Business data is rarely stored in one place.
Marketing teams may track performance in Google Analytics and Google Ads, sales teams work inside a CRM, finance teams use accounting software, and executives often rely on spreadsheets or manually prepared reports to understand what is actually happening.
Databox is designed to solve that problem.
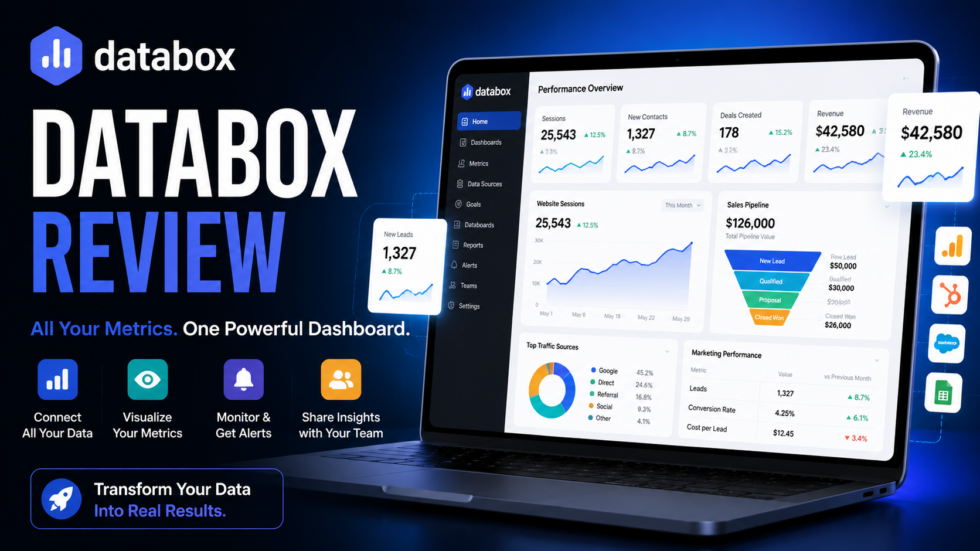
Databox is an AI-powered analytics, business intelligence, dashboard, and reporting platform that centralizes data from different tools and turns it into dashboards, reports, goals, forecasts, alerts, and AI-generated insights.
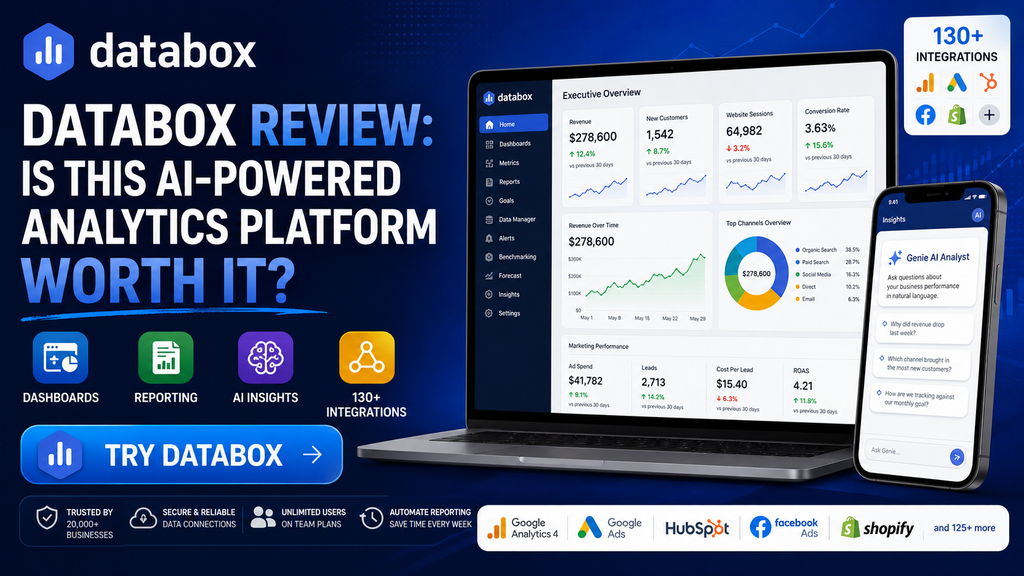
The platform currently supports 130+ integrations, including Google Analytics 4, Google Ads, HubSpot, Shopify, Facebook Ads, LinkedIn Ads, Stripe, Salesforce, Pipedrive, QuickBooks, spreadsheets, databases, and custom API integrations.
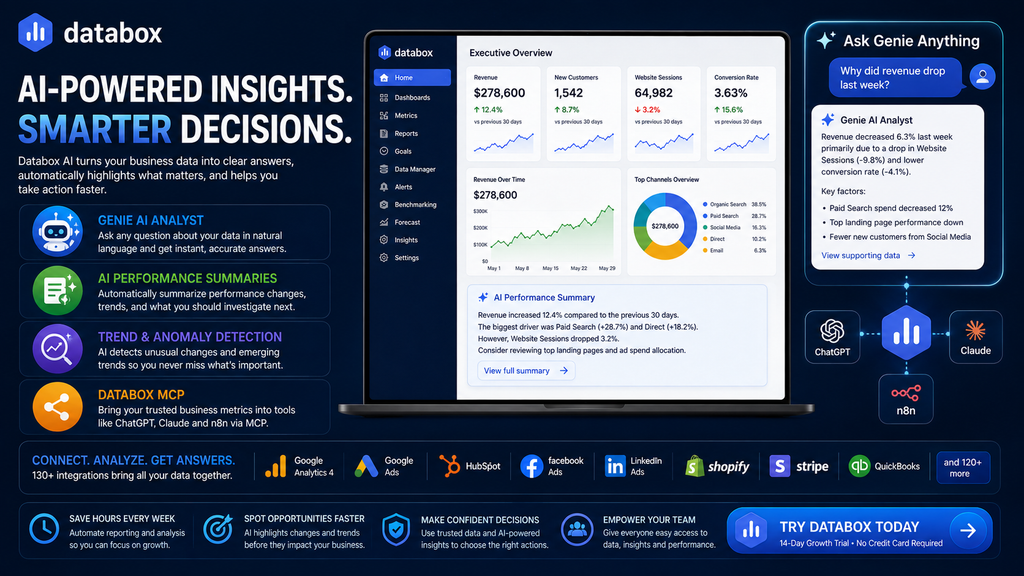
Its newer AI capabilities make the platform especially interesting. Genie, Databox’s AI analyst, lets users ask questions about business performance in natural language, while AI Performance Summaries explain trends and Databox MCP can bring trusted company metrics into tools such as ChatGPT, Claude, and n8n.
But is Databox worth adding to your analytics stack?
This Databox review covers its dashboards, integrations, reporting, AI tools, pricing, advantages, limitations, and ideal users.
Databox Review: Quick Verdict
Best For: Marketing teams, agencies, executives, SaaS businesses, sales teams, analysts, and companies that need to combine performance data from multiple platforms.
Main Strength: Centralizes business data and turns it into customizable dashboards, automated reports, forecasts, alerts, and AI-generated insights.
Main Limitation: Costs can increase when teams need many data sources, faster synchronization, advanced analysis, or enterprise functionality.
Free Plan: Yes. Databox currently offers a Free plan with three data sources, one dashboard/report, 10 custom metrics, and 50 monthly AI credits.
Free Trial: New users currently receive a 14-day Growth trial with no credit card required.
Standout Features: Genie AI Analyst, dashboards, automated reporting, 130+ integrations, custom metrics, goals, forecasting, anomaly detection, datasets, and MCP connectivity.
Verdict: Databox is particularly valuable if your biggest analytics problem is not collecting more data, but bringing scattered data together and turning it into information people can actually understand and act on.
What Is Databox?
Databox is an all-in-one analytics and performance-management platform.
Instead of signing into multiple apps every morning and manually combining numbers into spreadsheets, Databox can pull metrics from different systems and present them through a centralized analytics workspace.
The platform organizes its product around several major areas:
- Metrics & KPIs
- Dashboards
- Reports
- Goals
- OKRs
- Data preparation
- AI analysis
- Forecasting
- Automated notifications
- Integrations
- MCP and API connectivity
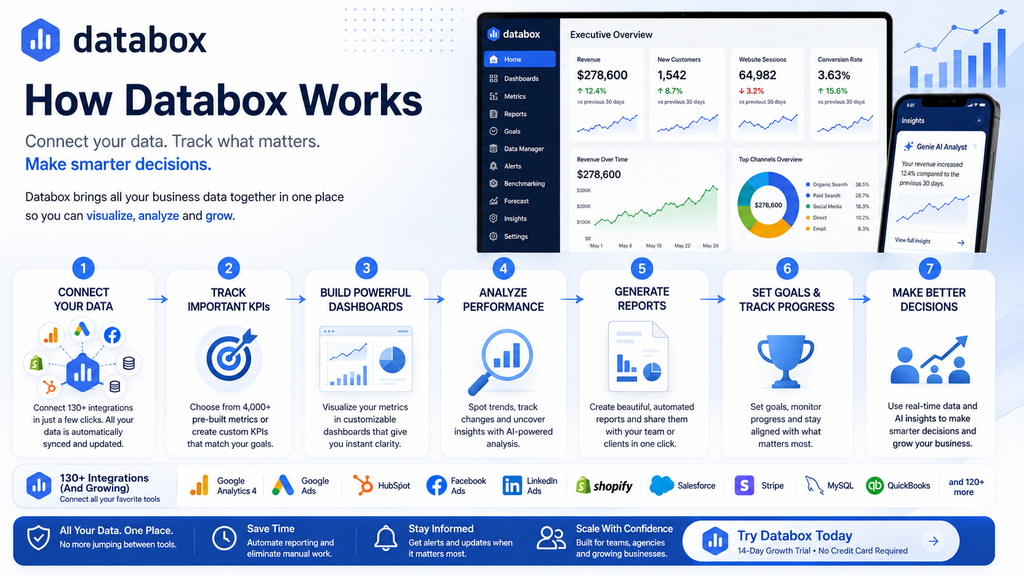
A typical workflow might look like:
Connect Data → Build KPIs → Create Dashboard → Analyze Performance → Generate Report → Share Insights → Set Goals → Forecast Results
This is useful because analytics becomes much less valuable when every department works from a different version of the truth.
Databox aims to create a single source of truth for business performance.
Databox Key Features
1. Custom Performance Dashboards
Dashboards are one of the foundations of Databox.
Users can connect business data and visualize important metrics without manually creating charts every time a report is needed.
Databox currently offers access to 4,000+ pre-built metrics, along with templates and customizable dashboards.
Dashboards can track metrics such as:
Revenue • Leads • Conversion Rate • Advertising Spend • Website Traffic • Pipeline • Sales • Customer Acquisition • Profitability
Different dashboards can then be created for different teams.
A marketing manager may monitor advertising and lead-generation KPIs, while leadership could use an executive dashboard focused on revenue, growth, and targets.
2. 130+ Data Integrations
Databox becomes much more useful when multiple platforms are involved.
Its current integration ecosystem supports more than 130 data connections, including popular platforms such as:
- Google Analytics 4
- Google Ads
- HubSpot
- Salesforce
- Shopify
- Facebook Ads
- LinkedIn Ads
- Stripe
- QuickBooks
- Pipedrive
- Google Sheets
- Excel
- BigQuery
- MySQL
- PostgreSQL
- Snowflake
Businesses can also send structured data through the Databox API.
This means a dashboard doesn’t have to represent only marketing performance.
It can potentially combine marketing + sales + finance + product + operational metrics.
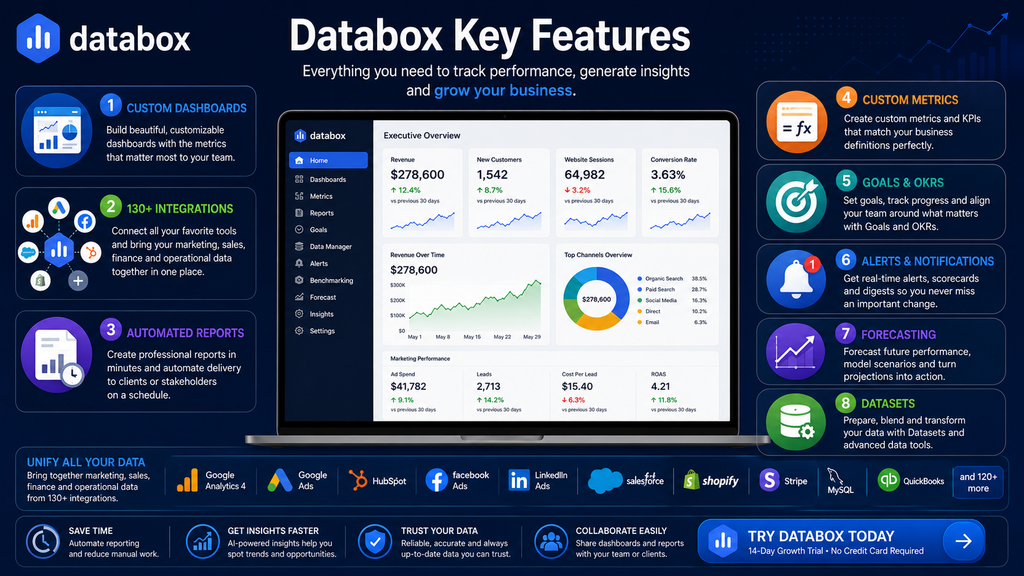
3. Genie AI Analyst
One of Databox’s most important newer features is Genie.
Genie functions as an AI-powered data analyst.
Instead of manually navigating reports and filters, users can ask questions about their performance using natural language.
For example:
“Why did revenue drop this month?”
“Which marketing channel improved the most?”
“How are we performing against our target?”
Genie interprets the question, finds relevant account data, and produces a contextual response. It can also help create metrics, dashboards, datasets, and goals using prompts.
The important distinction is that Genie works with data already connected to Databox rather than providing generic business advice.
4. AI Performance Summaries
Not every stakeholder wants to interpret dashboards.
Sometimes they simply want to know:
What changed? Why does it matter? What should we investigate next?
Databox provides AI-generated Performance Summaries that analyze metrics and translate performance changes into readable explanations.
These summaries can identify trends, highlight changes, and provide recommendations based on the connected data.
This can be particularly useful for executives and clients who want context rather than another screen full of graphs.
5. Automated Reporting
Manual reporting can become one of the most repetitive parts of analytics.
Databox allows teams to create reports that combine:
- Dashboards
- Metrics
- Written explanations
- AI summaries
- Dynamic data
- Performance insights
Reports can then be shared with stakeholders rather than rebuilt from scratch every reporting period.
This is particularly attractive for agencies that prepare recurring reports for multiple clients.
6. Alerts, Scorecards & Notifications
Teams shouldn’t need to continuously refresh a dashboard just to discover an important change.
Databox supports automated performance notifications through features such as:
Alerts • Scorecards • Scheduled Snapshots • Digests • Slack Updates
For example:
Conversion Rate Falls → Alert Sent
or:
Weekly KPI Summary → Automatically Delivered
This moves analytics away from passive dashboards toward proactive performance monitoring.
7. Goals & Performance Management
Databox also supports goal tracking.
Businesses can define targets and monitor progress using the same metrics already connected to the analytics system.
For example:
Monthly Revenue Goal → $500,000
Current Revenue → $382,000
Progress → 76%
Higher-level functionality also includes OKRs and forecasting depending on the subscription.
This makes Databox useful not only for understanding historical performance but also for managing future targets.
8. Forecasting
Growth users can access forecasting functionality.
Databox can forecast how a metric may perform over the next:
Month • Quarter • Year
Teams can also explore scenarios and turn projected performance into goals.
This is particularly useful for revenue, sales, marketing, and executive planning.
Historical reporting answers:
“What happened?”
Forecasting adds:
“Where might we be heading?”
9. Datasets & Custom Metrics
More advanced teams may need to work with data that doesn’t fit neatly into pre-built integrations.
Databox provides Datasets for preparing and structuring raw data from one or multiple sources.
Users can apply filters, calculate additional columns, and create custom metrics based on their own business definitions.
This is important because two businesses may define a seemingly simple metric like “qualified lead” very differently.
Custom metrics allow analytics to reflect how your company actually measures performance.
10. Databox MCP
Databox MCP is another particularly interesting AI-oriented capability.
It allows connected business data to be accessed through supported AI tools and workflows.
Databox specifically describes integrations with environments such as ChatGPT, Claude, and n8n, allowing teams to analyze metrics or trigger workflows without constantly opening Databox itself.
A future-facing analytics workflow could therefore become:
Business Data → Databox → MCP → AI Assistant → Question → Insight → Automated Action
This is a meaningful evolution from traditional dashboard software.
Databox Pricing
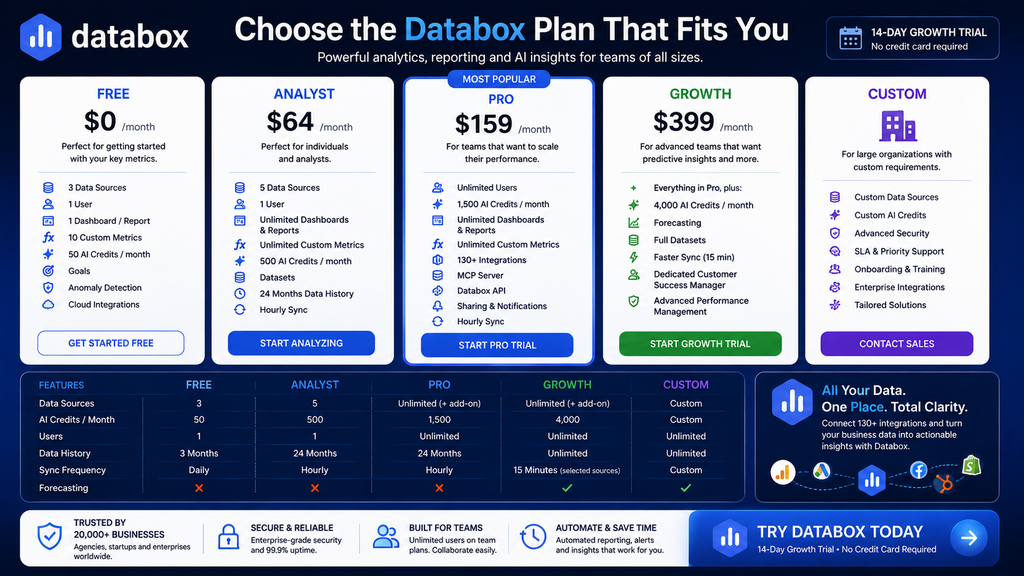
Databox currently separates its standard analytics plans into Free, Analyst, Pro, Growth, and Custom tiers.
When billed annually, current published pricing is:
| Plan | Price | Best For |
|---|---|---|
| Free | $0/month | Basic KPI tracking |
| Analyst | $64/month | Individual analysts |
| Pro | $159/month | Teams |
| Growth | $399/month | Advanced analytics teams |
| Custom | Custom | Enterprise requirements |
Databox currently offers a 20% annual-billing discount, and Pro/Growth can add additional data sources for an extra fee.
Free – $0
The Free plan currently includes:
- 3 data sources
- 1 user
- 1 dashboard/report
- 10 custom metrics
- 50 AI credits per month
- Cloud integrations
- Goals
- Anomaly detection
It’s a useful option for testing the basic Databox experience before committing to a subscription.
Analyst – $64/Month
Analyst is aimed at individual operators who need deeper analytics.
It currently provides:
- 5 data sources
- 1 user
- Unlimited dashboards and reports
- Unlimited custom metrics
- Datasets
- 500 monthly AI credits
- 24 months of historical data
- Hourly synchronization
This is likely the best fit for a solo analyst, consultant, or business owner who doesn’t need multiple team members.
Pro – $159/Month
Pro moves Databox toward team analytics.
The plan currently includes:
- Unlimited users
- 1,500 AI credits/month
- Unlimited dashboards and reports
- Unlimited custom metrics
- 130+ integrations
- MCP server
- Databox API
- Sharing and notifications
- Hourly synchronization
This is where Databox becomes much more attractive for organizations that want several departments working from the same analytics environment.
Growth – $399/Month
Growth is currently marked as the most popular standard plan.
It includes everything in Pro and adds capabilities such as:
- 4,000 AI credits/month
- Full datasets
- Forecasting
- Faster synchronization on supported data sources
- Dedicated customer success manager
- More advanced performance management
Growth makes the most sense when analytics has become part of daily business operations rather than occasional reporting.
Databox Pros and Cons
Pros
Centralized Analytics: Bring marketing, sales, finance, and operational KPIs together.
Strong Integration Ecosystem: More than 130 supported integrations plus databases, spreadsheets, and API connectivity.
Excellent Dashboards: Large library of pre-built metrics and customizable visualization options.
Genie AI Analyst: Ask questions about your connected business data in natural language.
AI Performance Summaries: Helps stakeholders understand what changed without manually interpreting every chart.
Automated Reporting: Particularly useful for recurring internal and client reports.
Unlimited Users on Team Plans: Pro, Growth, and Custom currently include unlimited users rather than per-seat pricing.
Forecasting & Goals: Useful for moving from historical analytics toward performance management.
Free Plan Available: Businesses can begin without a paid subscription.
Databox Cons
Advanced Plans Become Expensive: Growth currently costs $399/month when billed annually.
Data-Source Costs Can Increase: Organizations connecting many accounts or properties may pay for additional data sources.
Free Plan Is Limited: Three data sources and one dashboard may become restrictive quickly.
Advanced Analytics Require Setup: Custom datasets, metrics, forecasting, and integrations still require a clear understanding of what your company wants to measure.
May Be More Than Simple Businesses Need: A small company tracking only a handful of KPIs could potentially manage with simpler analytics tools.
Who Is Databox Best For?
Marketing Teams
Marketing departments can combine advertising, website, CRM, and conversion metrics into centralized performance dashboards.
Agencies
Agencies can automate reporting and maintain separate client analytics environments. Databox also offers dedicated agency pricing with client-account functionality.
SaaS Companies
SaaS businesses can combine marketing, sales, revenue, and other operational KPIs into a unified performance view.
Executives
Executives who don’t want to navigate several reporting tools can use high-level dashboards, automated summaries, goals, and forecasts.
Business Analysts
Analysts can work with datasets, custom metrics, integrations, and AI-assisted exploration rather than relying entirely on spreadsheets.
Databox vs Traditional Spreadsheet Reporting
| Feature | Databox | Manual Spreadsheets |
|---|---|---|
| Automatic Data Sync | ✅ | Usually ❌ |
| Interactive Dashboards | ✅ | Limited |
| 130+ Integrations | ✅ | Manual |
| AI Analysis | ✅ | Limited |
| Automated Reports | ✅ | Manual |
| KPI Alerts | ✅ | Limited |
| Custom Metrics | ✅ | ✅ |
| Goals | ✅ | Manual |
| Forecasting | ✅ Growth | Manual |
| Client Sharing | ✅ | More Difficult |
The biggest advantage isn’t simply prettier dashboards.
Databox replaces a workflow like:
Export → Copy → Paste → Build Charts → Explain Results → Email Report
with something much closer to:
Connect → Analyze → Automate → Share
Is Databox Worth It?
Databox is most valuable when your organization already has too much fragmented data.
If your team checks Google Analytics, advertising platforms, CRM reports, spreadsheets, and finance tools separately, the time spent collecting numbers can become almost as significant as the time spent analyzing them.
Databox addresses that problem by creating one analytics layer across those tools.
Its newer AI functionality makes the proposition stronger.
Instead of simply seeing a chart, teams can now ask questions through Genie, receive performance summaries, and even work with Databox metrics from external AI environments through MCP.
For small businesses with very simple analytics requirements, the paid plans may be unnecessary.
But for marketing teams, agencies, SaaS companies, analysts, and leadership teams that regularly prepare reports and monitor many KPIs, Databox can save substantial reporting time.
Frequently Asked Questions
What Is Databox?
Databox is an analytics, dashboard, reporting, AI analysis, and performance-management platform that centralizes business data from multiple tools.
Is Databox Free?
Yes. Databox currently offers a Free plan with three data sources, one dashboard/report, one user, 10 custom metrics, and 50 monthly AI credits.
Does Databox Have a Free Trial?
Yes. New users currently start with a 14-day trial of Growth, and Databox states that no credit card is required.
How Much Does Databox Cost?
Current annual-billing prices are $64/month for Analyst, $159/month for Pro, and $399/month for Growth, alongside Free and Custom options.
Does Databox Use AI?
Yes. Databox provides Genie AI Analyst, AI Performance Summaries, generative analytics capabilities, and MCP connectivity.
How Many Integrations Does Databox Have?
Databox currently advertises 130+ integrations, spanning marketing, CRM, e-commerce, finance, databases, spreadsheets, and custom APIs.
Is Databox Good for Agencies?
Yes. Automated reporting, dashboards, sharing, client accounts, and agency-specific plans make Databox particularly relevant for agencies.
Final Verdict: Should You Use Databox?
Databox has evolved beyond being simply a dashboard builder.
It now combines data integration, dashboards, reporting, custom metrics, goals, forecasting, anomaly detection, data preparation, AI analysis, automated reporting, and MCP connectivity in one analytics environment.
Best For: Marketing teams, agencies, SaaS companies, executives, analysts, sales organizations, and data-driven businesses.
Main Strength: Turns scattered business data into centralized, understandable, and increasingly AI-assisted performance intelligence.
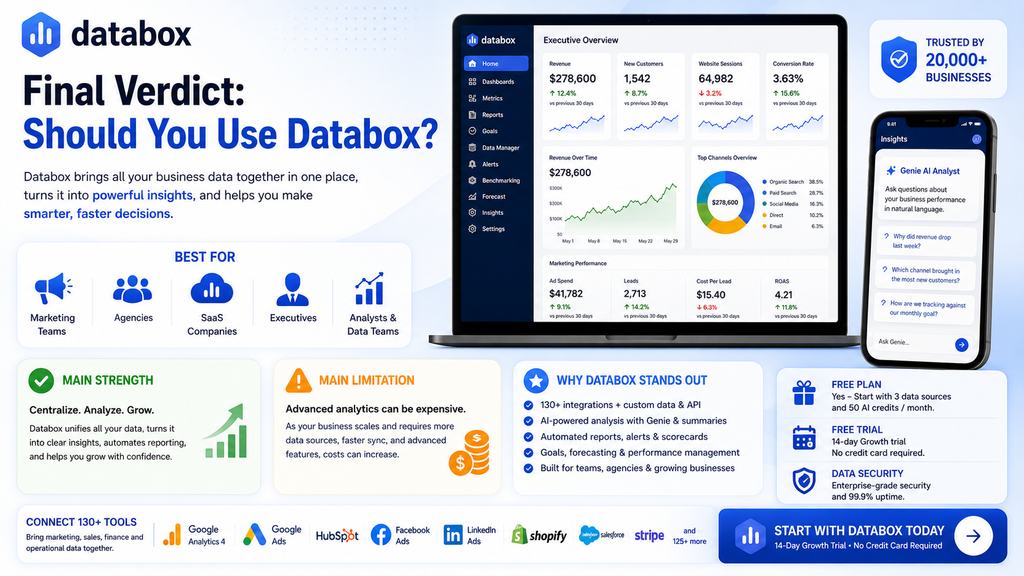
Main Limitation: Costs rise as organizations require additional data sources and more advanced analytics capabilities.
Free Option: Yes.
Free Trial: 14 days on the Growth plan.
Final Verdict: Databox is worth considering if your business has outgrown manual spreadsheets or fragmented reporting. Its strongest advantage is not simply visualizing metrics—it helps teams centralize data, understand performance, automate reporting, and make faster decisions from one source of truth.